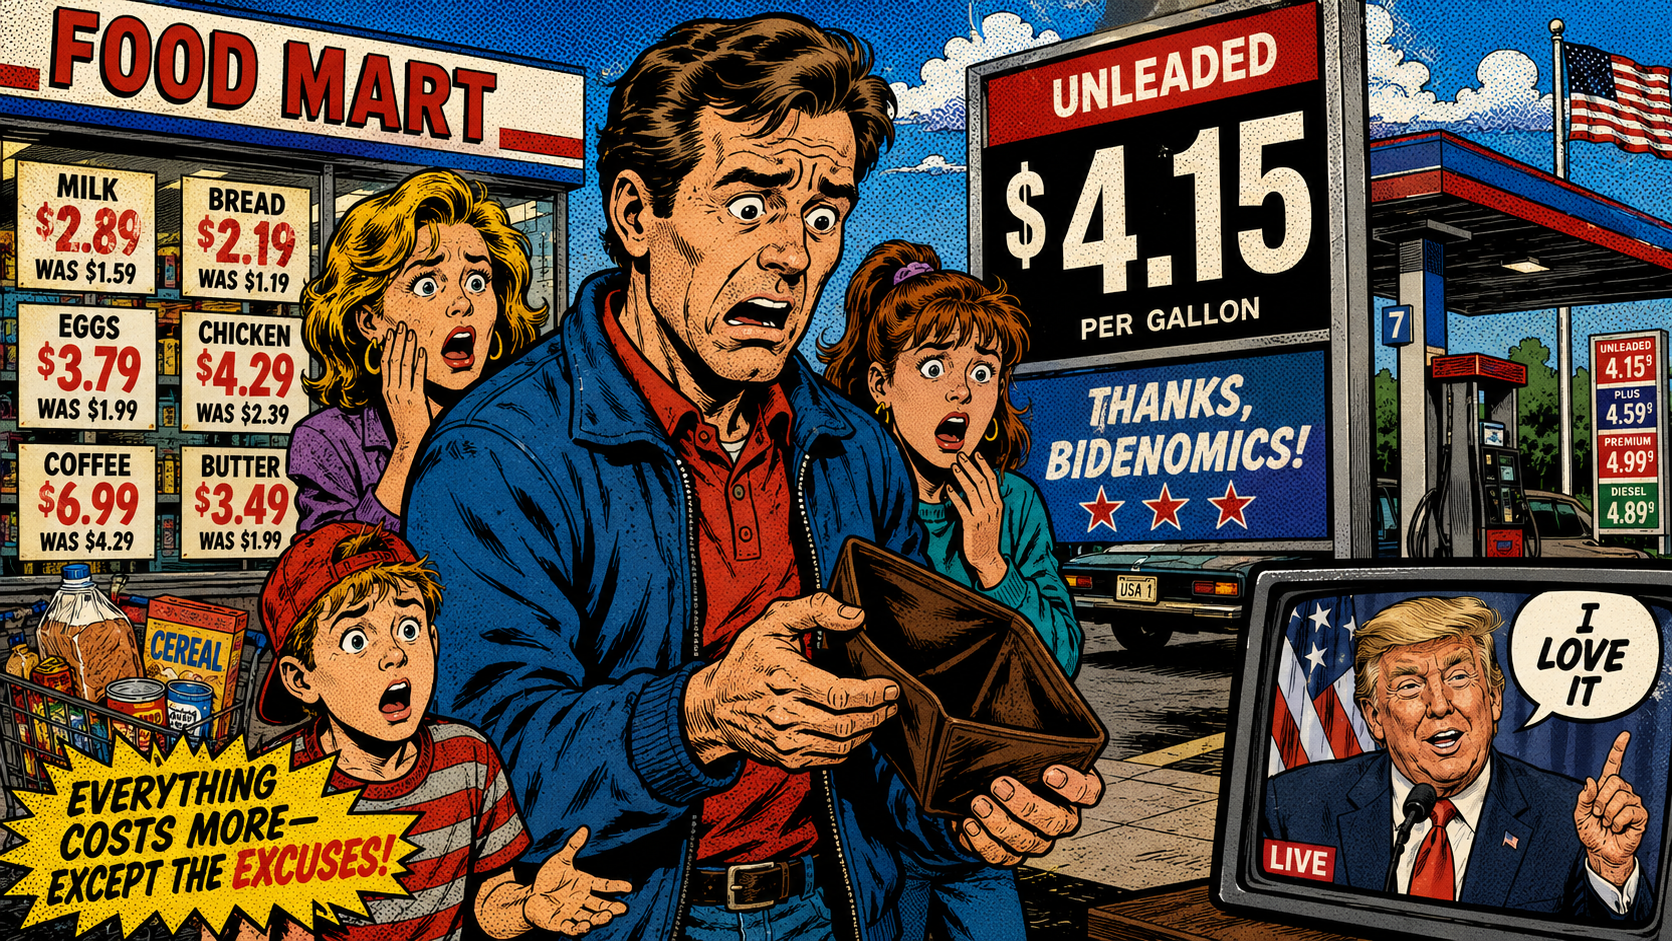
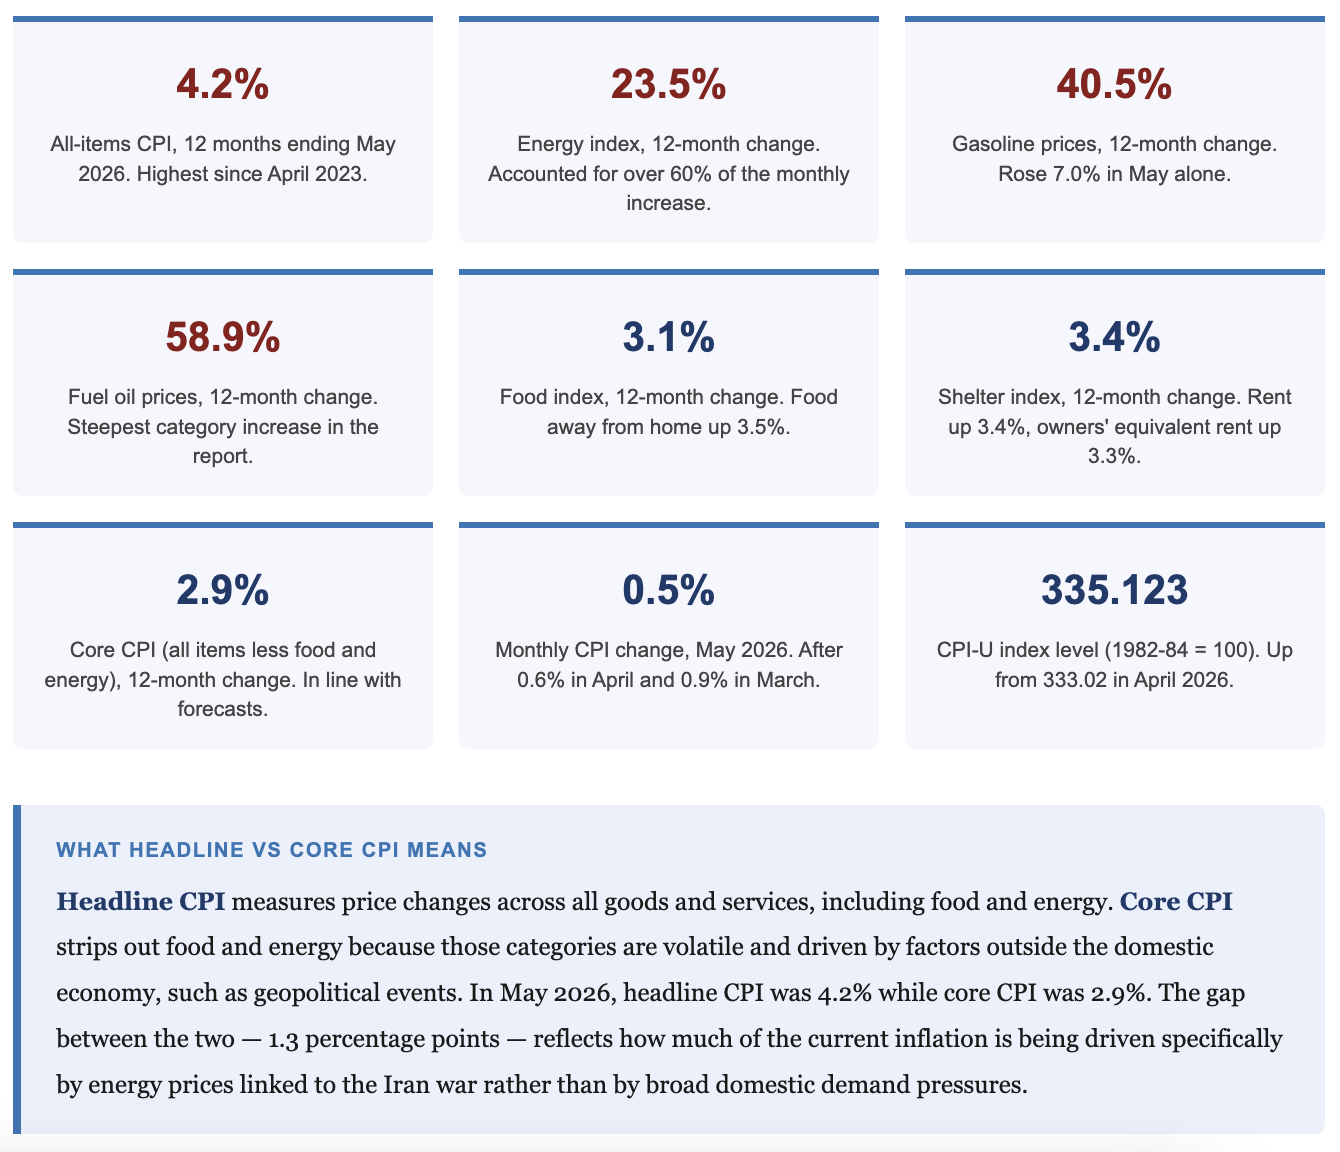
On June 10, 2026, the US Bureau of Labor Statistics released its Consumer Price Index report for May 2026. The headline number: prices rose 4.2% over the previous 12 months, the highest annual inflation rate since April 2023 and the third consecutive monthly acceleration. When a reporter asked President Trump whether he was concerned, he replied in the Oval Office: “No, I love it. The numbers were great.” He then added: “You know what I really love? I love the inflation.” As Time Magazine reported on June 11, 2026, Trump predicted prices would “come down like a rock” once the Iran war ends. This article explains what US inflation 2026 actually shows, category by category, what drove the numbers, and what independent economic forecasters say happens next.
The 4.2% figure matters beyond its headline status. When Trump won the 2024 presidential election, his central economic promise was to bring prices down. Inflation was 2.9% when he took office in January 2025 and has since climbed. The May 2026 reading represents the highest inflation rate of his second term and arrives five months before congressional elections in which his party’s House and Senate majorities are on the line. An Economist/YouGov poll released on the same day as the CPI report showed 63% of Americans disapprove of Trump’s handling of the economy. The University of Michigan’s consumer sentiment index, which fell to a record low of 48.2 in May 2026, shows the data is registering with the public before it registers in election results.
US Inflation 2026: The May Numbers at a Glance
All figures below are sourced directly from the BLS Consumer Price Index News Release for May 2026, published June 10, 2026. The CPI is based on prices collected each month from approximately 22,000 retail establishments and 6,000 housing units across 75 urban areas in the United States.
What Is Driving US Inflation 2026: The Energy Shock
The BLS report is unambiguous about the source of the surge: the energy index accounted for over 60% of the monthly all-items increase in May 2026. That energy surge traces directly to a single event: the start of the US war with Iran on February 28, 2026, and Iran’s subsequent effective closure of the Strait of Hormuz.
What the Strait of Hormuz Is and Why It Matters
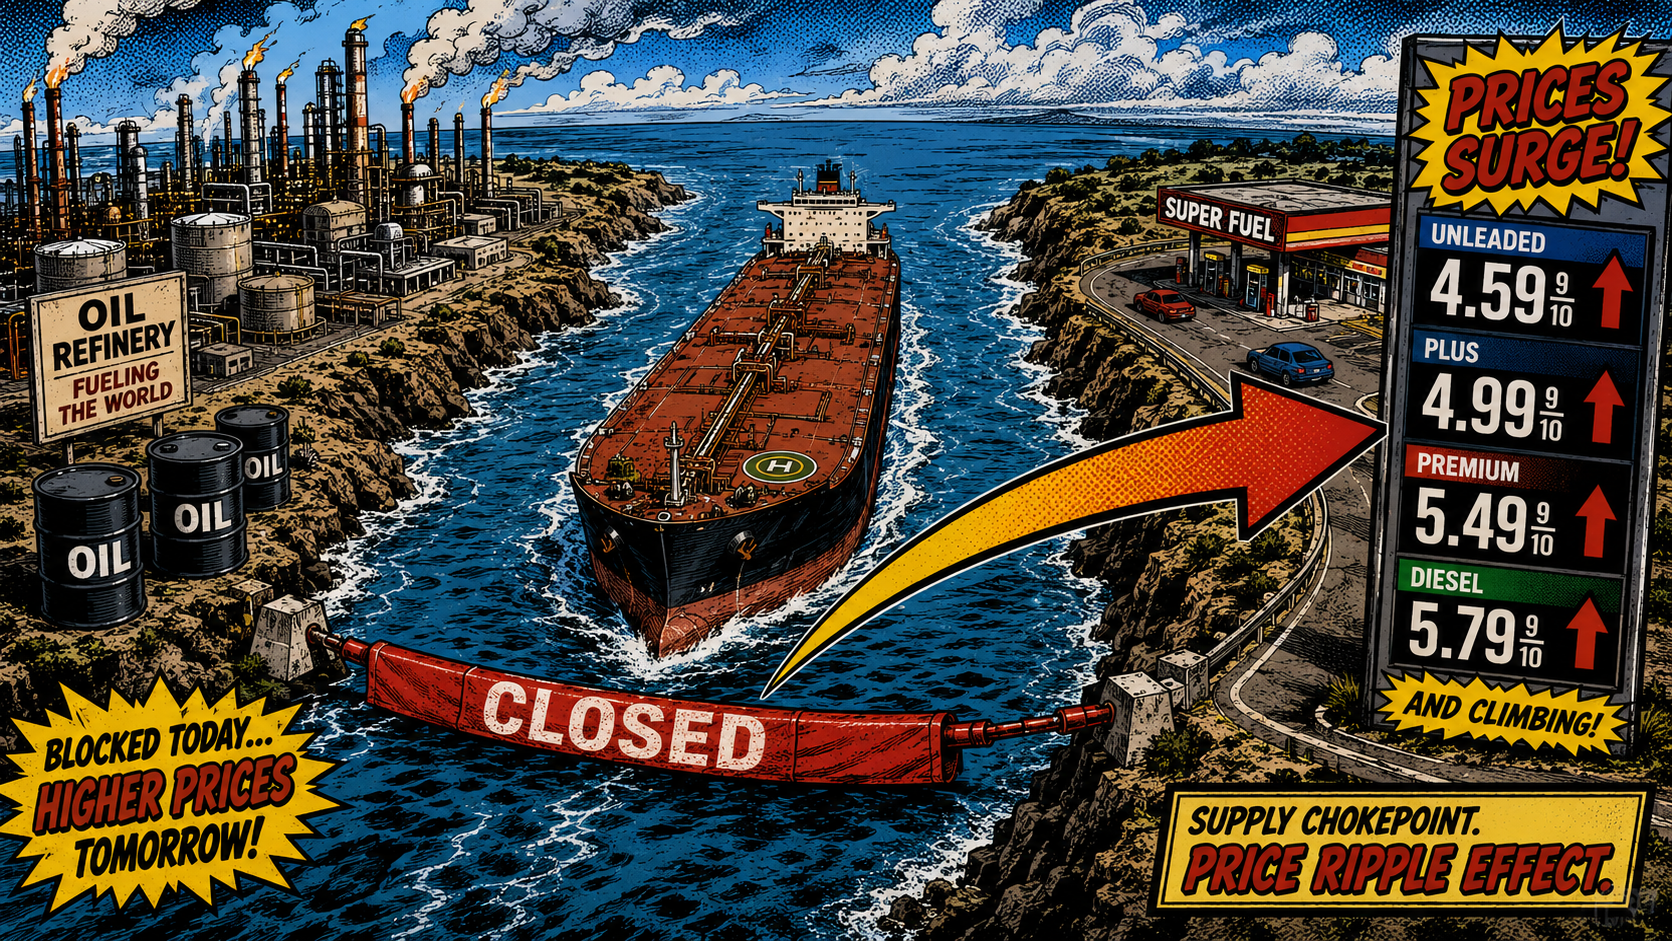
The Strait of Hormuz is a narrow waterway located between Iran and Oman at the mouth of the Persian Gulf. It is the only sea passage from the Persian Gulf to the open ocean. Before the war, approximately one-fifth of the world’s total oil supply passed through the strait daily, according to the US Energy Information Administration. Iran’s closure of the strait following the outbreak of war triggered one of the largest oil supply shocks on record.
The University of Michigan Research Seminar in Quantitative Economics (RSQE) forecast published in May 2026, authored by Gabriel M. Ehrlich and colleagues, confirmed that headline CPI jumped to 3.8% year-over-year in April, primarily driven by sharply higher gasoline prices following the outbreak of war with Iran. The Michigan forecast projected that the disruption would extend through 2026 and that shipping through the Strait would only normalize by end of the year, under the assumption that a negotiated agreement is reached within a few months.
Month-by-Month Inflation Trajectory Since the War Began
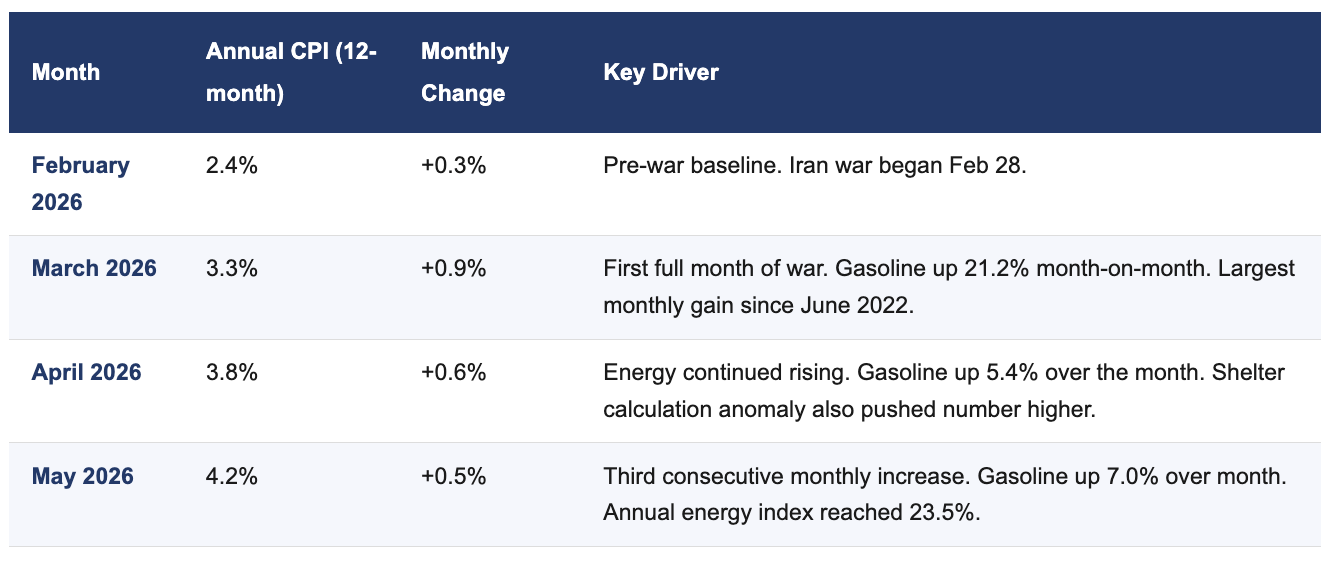
The trajectory shows three consecutive monthly accelerations following a single geopolitical event. Before the war, US inflation was running at 2.4% annually in February 2026, within range of the Federal Reserve’s 2% target. Three months later it had nearly doubled to 4.2%.
The Gas Price Calculation
As Time Magazine reported, the average price of a gallon of gasoline stood at $4.15 as of June 10, 2026, according to AAA data. That represents an increase of $1.17 per gallon since the war began on February 28, a nearly 40% price jump in approximately three and a half months. For a household driving a vehicle with a 15-gallon tank and filling up twice a week, that amounts to roughly $35 in additional fuel costs per week, or approximately $1,820 per year, compared to pre-war prices.
Category-by-Category Breakdown: What the BLS Data Shows
The following breakdown covers every major category in the BLS May 2026 CPI report. All figures are 12-month changes unless otherwise noted.
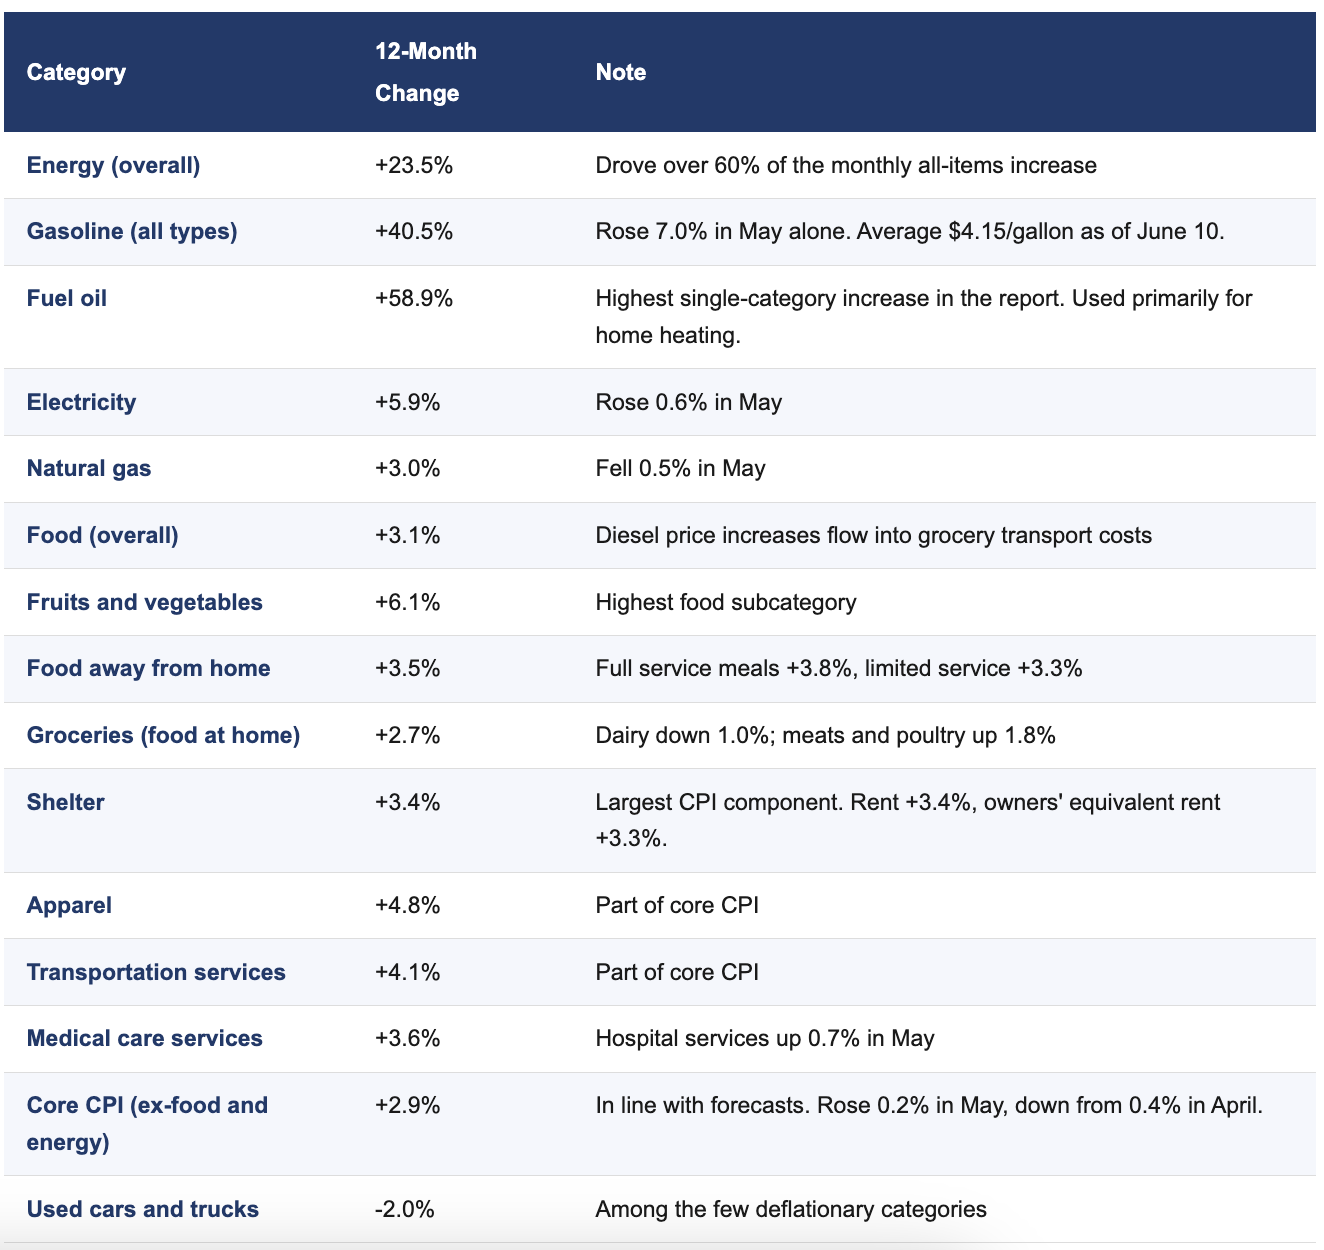
Two things stand out in this data. First, the energy-to-food transmission is direct and documented: diesel powers the trucks that move groceries from distribution centers to stores, and higher diesel prices raise transportation costs that eventually reach the shelf. Fruits and vegetables, which have the least processing and the most transportation exposure, came in at the highest food subcategory increase at 6.1%. Second, the core categories — apparel up 4.8%, transportation services up 4.1%, medical care services up 3.6% — show that inflation has moved beyond just energy into goods and services that Americans buy regularly. Even with energy stripped out, core CPI at 2.9% is still nearly a full percentage point above the Federal Reserve’s 2% target.
What the Federal Reserve and Independent Forecasters Say
The Federal Reserve’s inflation target is 2% annually, measured by PCE rather than CPI. The University of Michigan RSQE May 2026 forecast confirmed the FOMC has held the federal funds rate at 3.5 to 3.75% throughout 2026, with further rate cuts now delayed past the end of 2026. Core PCE inflation ran at a 4.3% annualized pace from December 2025 through March 2026. Several FOMC members have publicly raised the possibility of rate hikes, though none have been implemented.
The Michigan forecast projects headline CPI will peak near 4.0% in Q2 2026 and then decline as oil prices normalize, under the assumption a negotiated agreement on the Iran war is reached within a few months and the Strait of Hormuz largely reopens by year-end. The Fed’s 2% target is not projected to be reached until Q1 2028. The Stanford SIEPR 2026 economic outlook identified interest rate decisions and affordability as the top economic concerns for consumers heading into the midterms. The Joint Economic Committee Republicans’ Inflation Update tracks the cumulative household cost of inflation since January 2021 as part of the congressional political framing ahead of November.
How US Inflation 2026 Connects to the Midterm Elections
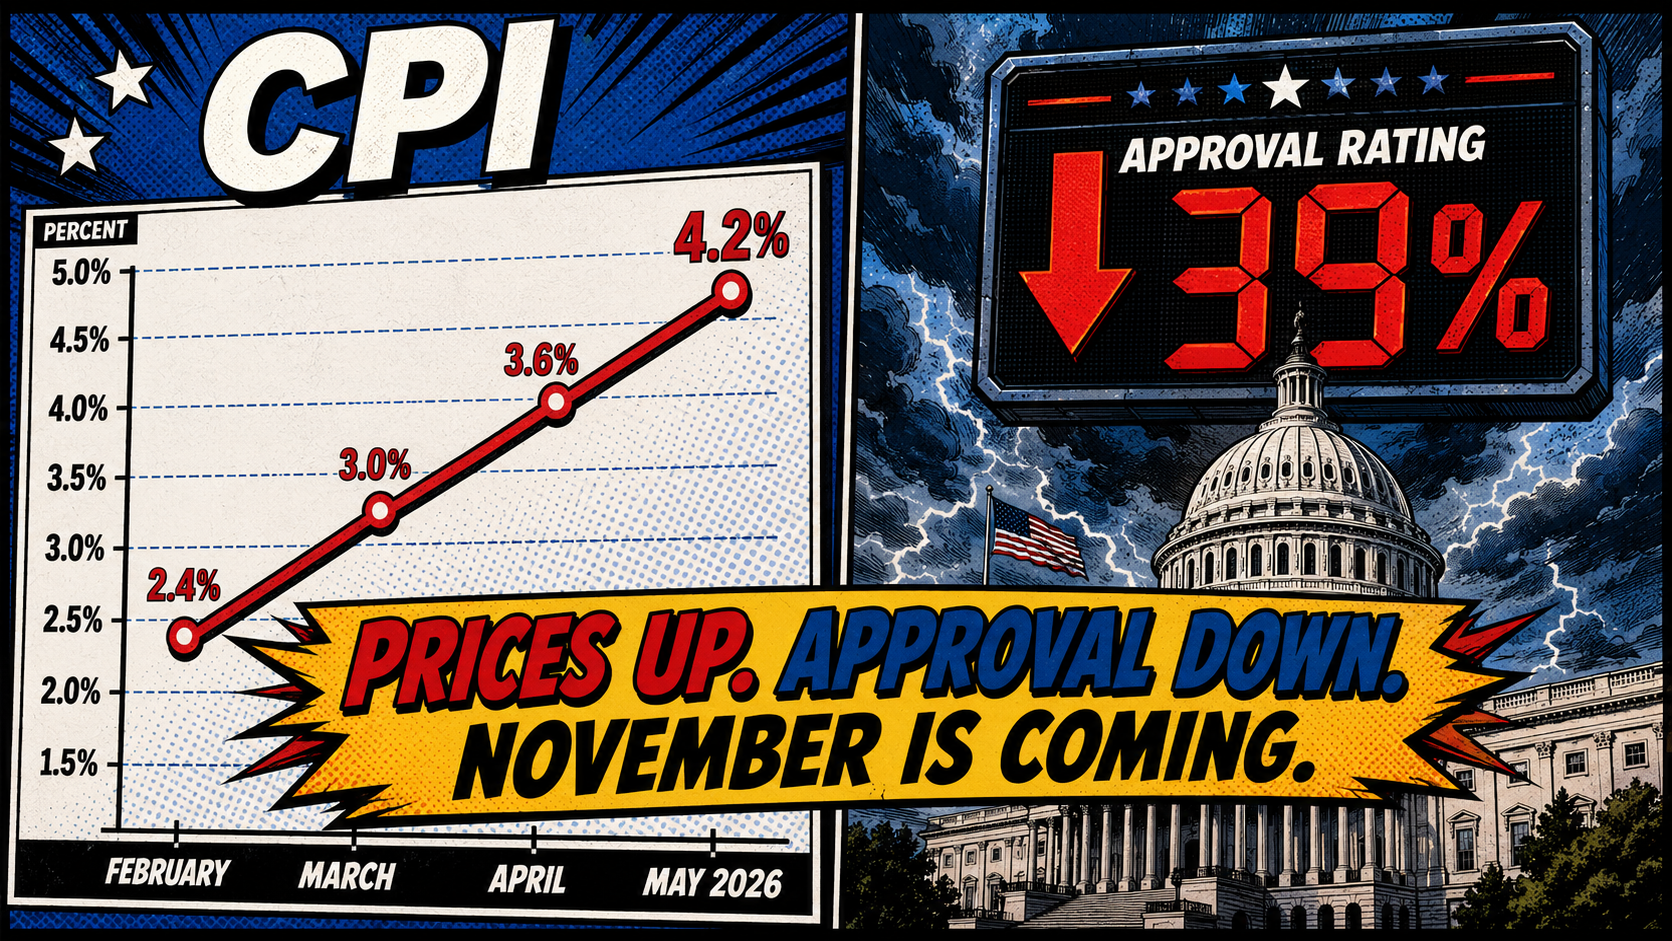
For readers following election updates in the US, the inflation data released June 10 lands five months before the November 3, 2026 general election. It is the single most politically consequential economic data point of the cycle.
Historical research on US midterm elections consistently shows that consumer economic conditions, and particularly the direction and level of inflation, correlate with the electoral performance of the president’s party. When voters feel economically squeezed, they tend to punish the party in power at the congressional level. Trump’s current 39% approval rating, as measured by the UMass Lowell and YouGov poll published in April 2026, combined with 63% disapproval on economic handling, places congressional Republicans in a historically difficult position heading into November.
Republicans are seeking to maintain their slim majorities in both the House and Senate. As Reuters reported on June 10, Republican members of Congress are concerned a consumer backlash over the cost of living could hand Democrats control of one or both chambers. The inflation trajectory between now and November 3 will be one of the most closely watched economic indicators of the cycle.
The next CPI report, covering the 12 months ending June 2026, is scheduled for release on July 14, 2026 at 8:30 a.m. ET. That report will determine whether the three-month acceleration has peaked or continued.
Related Reading on roadtotheelection.org
Also on this site
How Tariffs Impact Inflation, Jobs, and the Cost of Living in America — The Iran war energy shock is not the only force pushing prices higher. Tariffs add a separate layer of cost pressure to imported goods. This article explains how.
Fed’s Preferred Measure of Inflation Just Exceeded Expectations Amid US Elections Impact — The Federal Reserve tracks PCE inflation rather than CPI. This article explains the difference and why the Fed’s measure matters for interest rate decisions.
US Economic Growth Eaten Alive By Inflation Amid US Election Betting Odds — How inflation erodes real GDP growth and what that means for the broader economic picture heading into the elections.
The Bottom Line
US inflation 2026 hit 4.2% in May, its highest level in three years, driven overwhelmingly by energy prices connected to the Iran war and the closure of the Strait of Hormuz. Gasoline is up 40.5% year-over-year. Fuel oil is up 58.9%. The average gallon of gas costs $4.15, up $1.17 since the war began in late February. Food is up 3.1%. Shelter is up 3.4%. Core inflation, which excludes food and energy, is running at 2.9%, below the headline rate and broadly in line with forecasts, suggesting the broader domestic economy is not generating the kind of demand-driven inflation seen in 2021 and 2022.
Independent forecasters at the University of Michigan project inflation will decline after the Iran conflict resolves and energy prices normalize, but that the Fed’s 2% target will not be reached until early 2028. Consumer sentiment is at a record low. Congressional Republicans face their most challenging electoral environment in years. The next CPI report on July 14 will be the next critical data point in understanding where US inflation 2026 goes from here, and what it means for the November 3 general election.
References:
US Bureau of Labor Statistics: “Consumer Price Index News Release, May 2026” (USDL-26-0824, released June 10, 2026)
BlsConsumer Price Index News Release – 2026 M05 Results
US Bureau of Labor Statistics: “Consumer Price Index Summary” (current release page)
BlsConsumer Price Index Summary – 2026 M05 Results
Time Magazine: “Trump Says ‘I Love the Inflation’ After Data Shows Fastest Price Hikes Since 2023” (June 11, 2026)
TimeTrump Says ‘I Love the Inflation’
University of Michigan RSQE: “United States Economic Outlook 2026-2028” by Ehrlich, Boca, Burton, Manaenkov, and Zhang (May 18, 2026)
Umichlsa.umich.edu/econ/rsqe/forecasts.html
Stanford Institute for Economic Policy Research (SIEPR): “The US Economy in 2026: What to Watch For” (Policy Brief, 2026)
StanfordThe U.S. economy in 2026: What to watch for
US Congress Joint Economic Committee Republicans: “Monthly Inflation Update” (jec.senate.gov)
Senatejec.senate.gov/public/index.cfm/republicans/inflation-update