
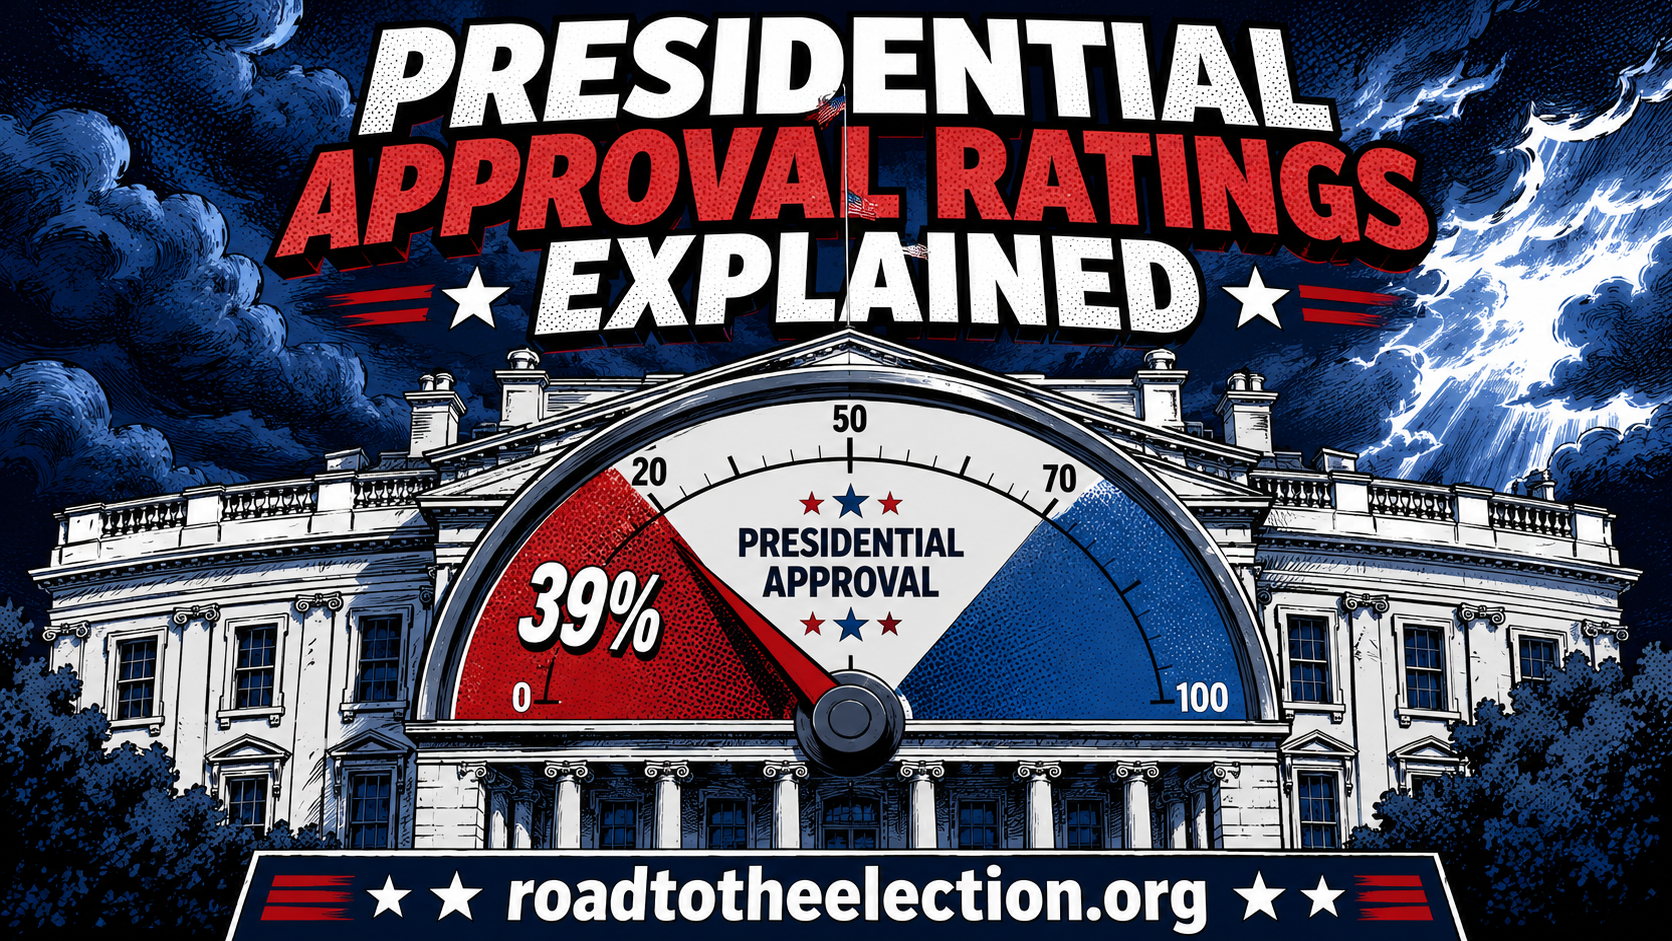
In March 2026, a national poll conducted by the Center for Public Opinion at UMass Lowell and YouGov found that only 39% of Americans approved of President Donald Trump’s job performance. That number sits at the center of one of the most closely watched and least fully understood systems in American politics: presidential approval ratings. This article explains exactly how that number is produced, who produces it, what it means historically, whether it can be trusted, and why it matters for election updates in the US in 2026 and beyond.
What Presidential Approval Ratings Are and Where They Came From
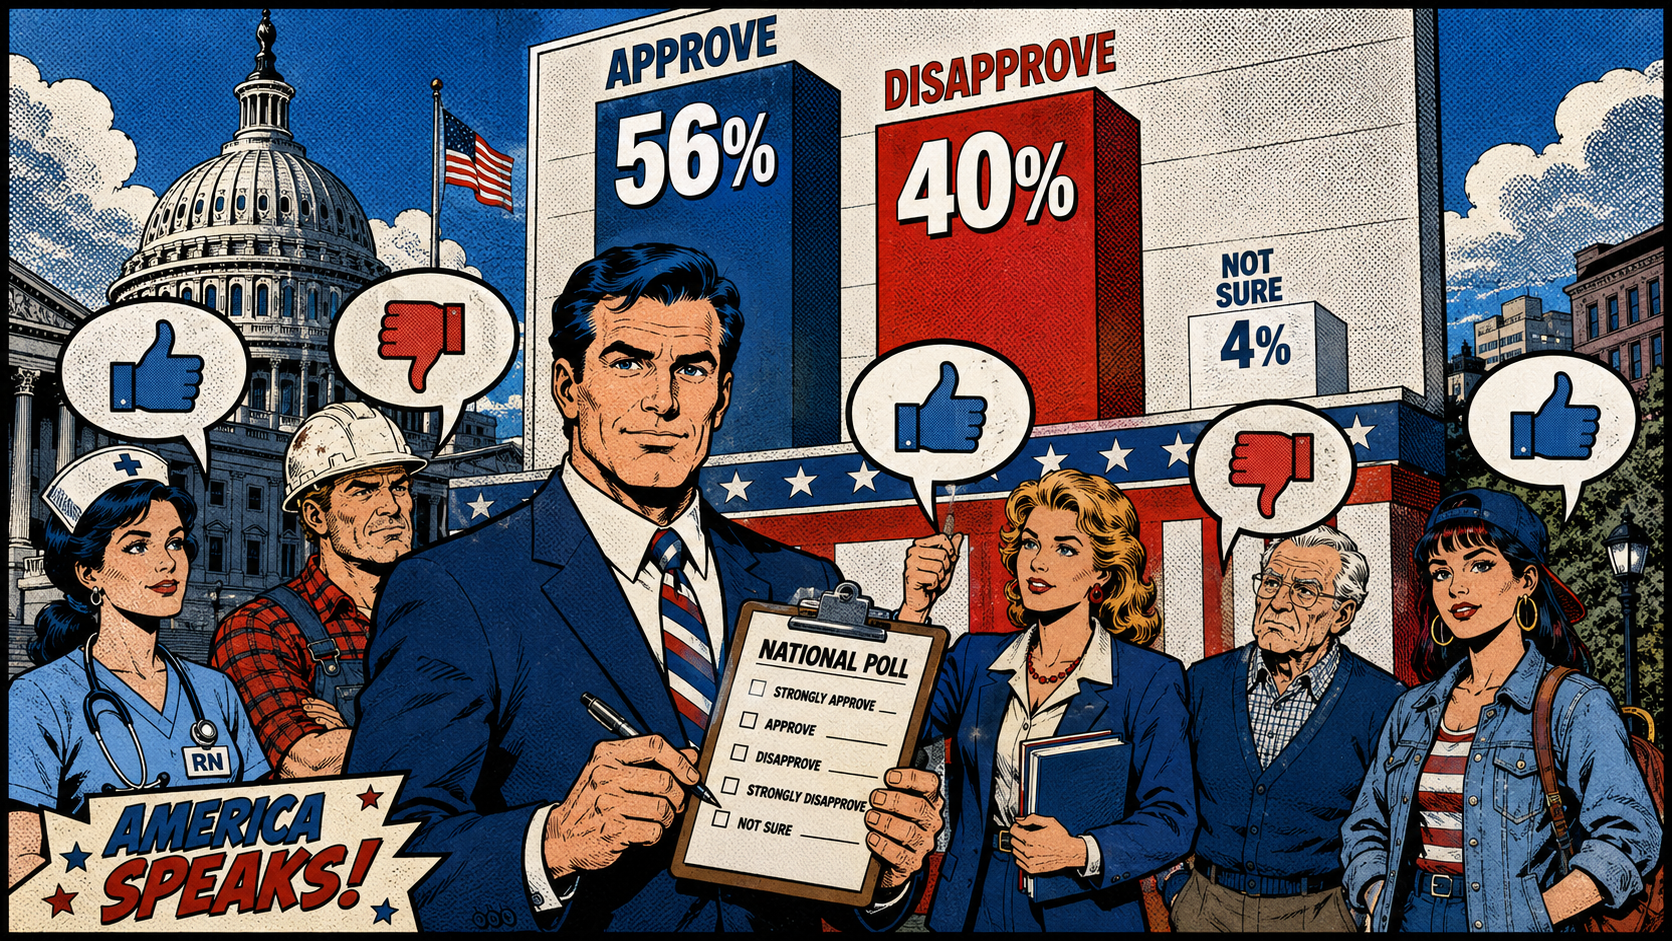
Presidential approval ratings measure the percentage of the public that approves of how the president is handling his or her job. The question is straightforward: respondents are asked whether they approve or disapprove of the way the president is performing. The result is expressed as a percentage. The standard approval question used today asks something close to: “Do you approve or disapprove of the way [name] is handling his job as president?”
This system was pioneered by George Gallup, founder of the American Institute of Public Opinion, which was later renamed after him. According to the Roper Center for Public Opinion Research at Cornell University, Gallup began developing presidential approval tracking in the 1930s as a way to measure public support for the president between elections. His early polls asked whether respondents would vote for Franklin Roosevelt again, but by August 1937 Gallup had shifted to questions focused on job performance rather than voting intention. That format, refined over the following decades, became the foundation for the modern approval rating system.
Gallup conducted presidential approval polling for nearly nine decades. In February 2026, the company announced it would no longer publish presidential approval or favorability ratings of individual political figures, ending what CNN described as the longest-running continuous effort to track US opinion of the president. Gallup stated in its official announcement that the decision reflected an evolution in its research priorities. Other major polling organizations including NBC News, CNN, Fox News, and YouGov continue to conduct and publish presidential approval ratings on a regular basis.
How Presidential Approval Ratings Are Measured: The Methodology
Understanding how presidential approval ratings are measured requires understanding the basics of survey research. No polling organization surveys every American. Instead, pollsters use a sample, a carefully selected subset of the population intended to represent the views of the broader public. The science of selecting that sample determines how reliable the result is.
Who Gets Asked
Most national approval polls survey between 800 and 1,500 adults. Some polls focus on registered voters or likely voters specifically, while others survey all American adults. This distinction matters: approval ratings among all adults tend to differ from those among registered voters or likely voters, because different groups vote at different rates and hold different views.
The sample is selected using one of several methods. Random digit dialing uses randomly generated phone numbers to reach respondents by telephone. Online panels recruit participants who have agreed to take surveys and are selected to match the demographic profile of the broader population. The goal in both cases is a sample that reflects the actual composition of the American public in terms of age, race, education, geographic region, and other characteristics.
Weighting
After data is collected, pollsters apply a statistical adjustment called weighting. If the raw sample overrepresents a particular group, such as older adults or college graduates, the data is weighted to bring it back into alignment with the known composition of the population based on census data. This process improves the accuracy of the final result but also introduces a degree of judgment: the pollster must decide which demographic characteristics to weight for and by how much.
Margin of Error
Every poll comes with a margin of error, typically expressed as plus or minus a number of percentage points at a stated confidence level, usually 95%. The UMass Lowell national poll that found Trump’s approval rating at 39% in March 2026 had an adjusted margin of error of plus or minus 4.05 percentage points. This means the true approval figure in the population could be anywhere between approximately 35% and 43%. A single poll number should always be understood within this range, not as a precise fixed figure.
The Standard Question
The most commonly used approval question in the US asks: “Do you approve or disapprove of the way [president’s name] is handling his job as president?” This wording has remained largely stable for decades, which is what makes historical comparisons possible. Changing the wording of the question, even slightly, can change the results, which is one reason consistent methodology matters in long-running polls.
Trump’s Approval Rating in 2026: What the Data Shows
The current picture of Trump’s approval rating in 2026 comes from multiple independent polling organizations, each using somewhat different methodologies but arriving at broadly consistent results.
The UMass Lowell and YouGov national poll conducted March 26 to March 30, 2026, surveyed 1,000 American adults and found:
Trump’s job approval: 39%
57% of respondents said their lives had become somewhat or much more difficult over the past six months
67% said the country is on the wrong track
49% expressed a great deal or a lot of frustration with the Trump administration’s economic policies
65% said the US is spending too much on the Iran conflict
Those figures represent a decline from the same center’s October 2025 poll, which found Trump’s approval at 42%, with 52% saying their lives had become more difficult and 65% saying the country was on the wrong track.
Gallup’s last published presidential approval figure, from December 2025, put Trump’s approval at 36%. His second-term peak had been 47% in February 2025, according to Gallup’s data. His 2025 annual average ranked among the lowest Gallup had recorded since launching the poll in the 1930s.
UMass Lowell’s director of survey research, John Cluverius, offered a direct assessment of the Iran war’s impact on the numbers: “Most wars start out popular, get more popular with strategic victories, but then lose popularity over time. Not only does the war appear to be dragging down Trump’s approval rating, but he seems to have skipped the typical surge of popularity for military action and gone straight to the decline.”
How Trump’s Numbers Compare to Other Presidents
The American Presidency Project at UC Santa Barbara maintains a complete record of final presidential job approval ratings, compiled from Gallup poll data, covering every president from Harry Truman through Joseph Biden. The data shows the following final approval ratings at the end of each presidency: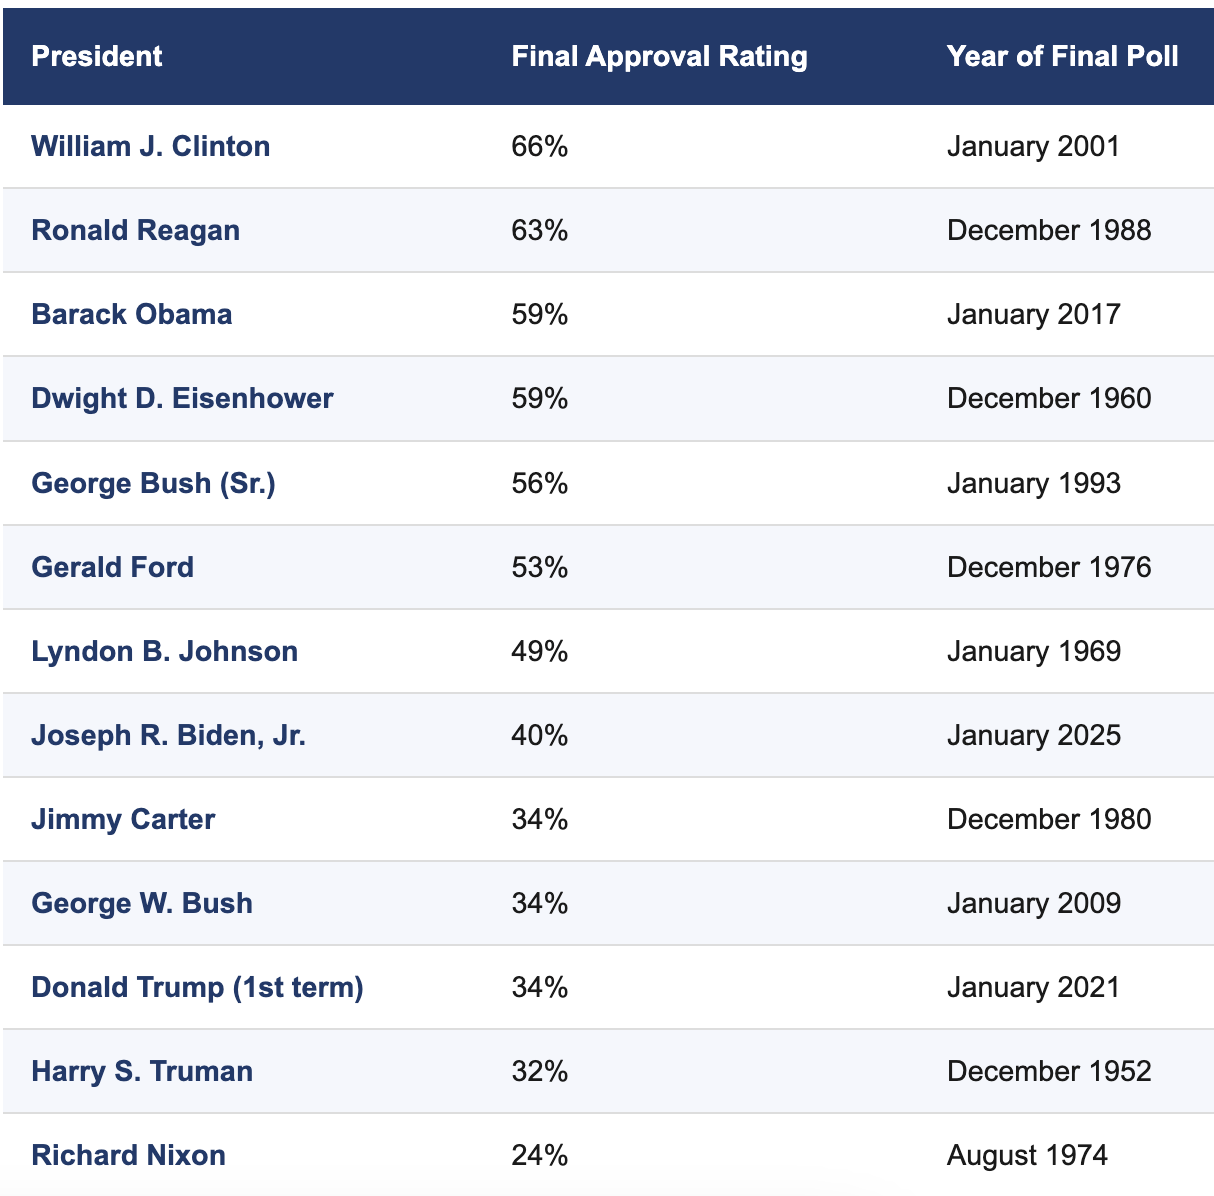
Source: The American Presidency Project, UC Santa Barbara. Data compiled from Gallup. Excludes presidents who died in office.
Trump’s first-term final approval of 34% tied with George W. Bush and Jimmy Carter for among the lowest final ratings on record. His second-term figures, currently in the high 30s across multiple polls, are tracking in a similar range.
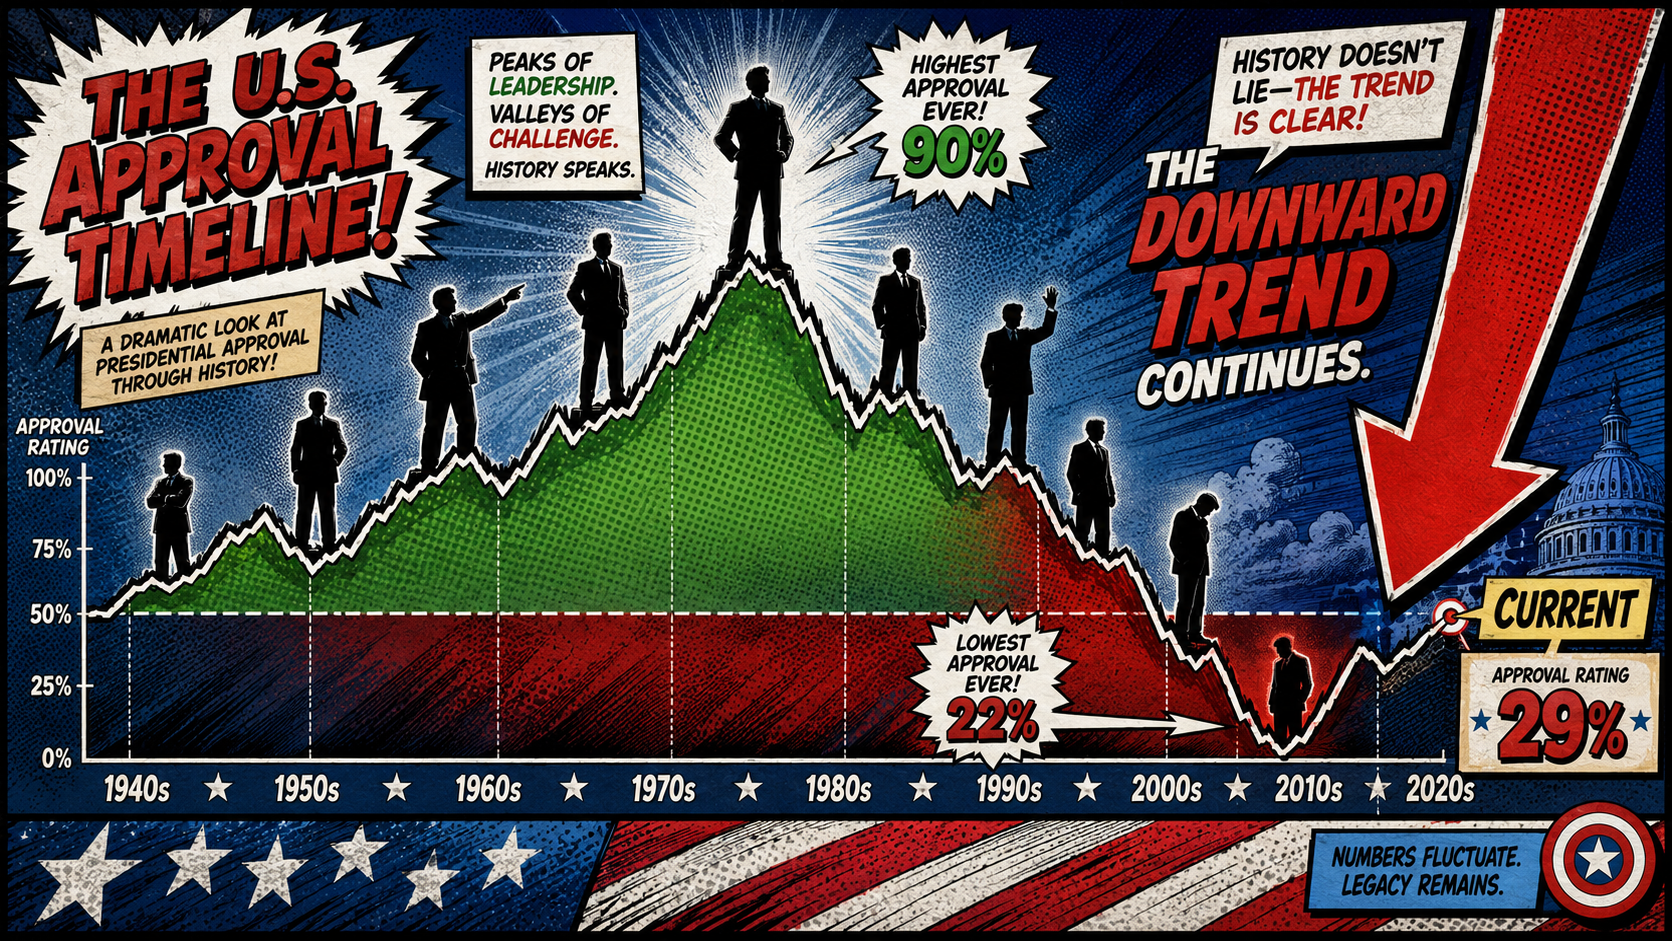
The Roper Center’s Presidential Approval Highs and Lows database provides the full historical range of approval highs and lows for every president since Truman. The highest single approval rating ever recorded in Gallup polling history was 90%, reached by George W. Bush on September 21 to 22, 2001, following the September 11 terrorist attacks. The previous record was 89%, held by George H.W. Bush during the 1991 Gulf War. The lowest recorded approval in Gallup history was 22%, recorded for Harry Truman in February 1952.
The Rally Round the Flag Effect: Why Approval Ratings Spike During Crises
One of the most documented phenomena in presidential approval polling is what political scientists call the rally round the flag effect. When the United States faces an external threat or military engagement, the president typically receives a short-term surge in approval as the public unifies in response to the crisis.
George W. Bush’s jump from 51% on September 10, 2001, to 90% by September 21 to 22, 2001, following the September 11 attacks represents the largest and longest-lasting rally effect ever recorded in Gallup’s history. According to Gallup’s own analysis, Bush sustained ratings above 85% for 16 consecutive weeks after the attacks, a duration far exceeding any previous rally effect. The second highest single-poll rating was 89%, recorded for George H.W. Bush during the Gulf War in 1991.
In 2026, UMass Lowell’s data suggests Trump did not experience a comparable rally effect following the start of the Iran conflict. As John Cluverius noted, the typical pattern of an initial popularity boost from military action appears to have been absent in this case.
What the Rally Effect Tells Us
The rally round the flag effect is not a measure of policy support. It reflects a temporary unification of public sentiment behind the president during a perceived national emergency. It typically fades within weeks to months as the initial crisis response gives way to sustained engagement and the return of normal political divisions. The size and duration of any rally effect depends heavily on the nature of the event, the level of bipartisan support it generates, and subsequent developments.
Is the Presidential Approval Rating Biased?
The question of whether presidential approval ratings are biased is one of the most common concerns readers raise, particularly during periods of intense political polarization. The answer requires separating two distinct issues: partisan bias in who conducts polls, and methodological limitations that affect all polls regardless of who conducts them.
Partisan Bias in Polling Organizations
Different polling organizations are associated with different media outlets and funding sources, which raises legitimate questions about independence. Fox News conducts its own polling. So does NBC News. Academic institutions like UMass Lowell conduct polls through their research centers. Aggregators like FiveThirtyEight collect and average results from dozens of pollsters, applying quality ratings based on historical accuracy.
The standard safeguard against organizational bias is transparency: reputable polls publish their full methodology, including sample size, field dates, the exact question wording, the margin of error, and the weighting procedures used. The UMass Lowell Center for Public Opinion is a member of the American Association for Public Opinion Research (AAPOR) Transparency Initiative, which requires disclosure of all methodological details. When a pollster does not publish its full methodology, the results deserve greater scrutiny.
Partisan Response Patterns
A structural challenge in modern approval polling is what researchers call partisan non-response bias. In a highly polarized environment, members of the party out of power may be less willing to participate in polls, which can skew results. Some polling organizations apply corrections for this; others do not. This is one reason different polls from the same time period can produce different approval numbers for the same president.
The Role of Poll Aggregation
Because any single poll carries a margin of error, the most reliable picture of presidential approval ratings comes from averaging across multiple independent polls. This approach, used by organizations like FiveThirtyEight and RealClearPolitics, reduces the impact of any single poll’s methodological quirks and produces a more stable and reliable estimate of public opinion over time.
One Number Is Never the Whole Story
A single approval rating from a single poll should always be interpreted with caution. The margin of error alone means the true figure could be several points higher or lower. Reading the methodology, checking it against other polls from the same period, and tracking trends over time produces a far more accurate picture than any single data point.
Why Gallup Stopped Tracking Presidential Approval in 2026
The decision by Gallup to end its presidential approval tracking in February 2026 is itself a significant development in the history of presidential approval ratings. Gallup had been tracking presidential approval continuously since the late 1930s, making it the longest-running such effort in polling history.
In its announcement, Gallup stated that leadership approval ratings are now “widely produced, aggregated and interpreted, and no longer represent an area where Gallup can make its most distinctive contribution.” The company said it would refocus its public polling on issues and conditions that shape people’s lives through its existing research programs.
Gallup explicitly stated that the decision was not made in response to political pressure from the White House. “This is a strategic shift solely based on Gallup’s research goals and priorities,” a spokesperson said.
At the time of the announcement, Trump’s Gallup approval rating had fallen to 36% in December 2025, down from a second-term peak of 47% in February 2025. Multiple other major polling organizations continue to track and publish presidential approval ratings on a regular basis.
Why Presidential Approval Ratings Matter for Elections
For anyone following election updates in the US, presidential approval ratings are not just a measure of personal popularity. They are a leading indicator of midterm election outcomes, congressional behavior, and the ability of a president to advance legislative priorities.
The Midterm Connection
The historical relationship between approval ratings and midterm elections is well established. When a president’s approval rating is below 50%, the president’s party tends to lose seats in the House of Representatives in the subsequent midterm election. When approval ratings fall into the high 30s or below, the losses tend to be more severe.
The historical pattern works in both directions. Presidents with strong approval ratings heading into midterms see their parties perform better. George W. Bush’s approval rating, still elevated after September 11, contributed to the unusual result of his party gaining seats in the 2002 midterms, one of only a handful of times the president’s party has gained House seats in a midterm election since World War II.
With Trump’s approval ratings currently in the high 30s across multiple polls, congressional Republicans are facing a historically challenging environment heading into November 3, 2026. As one analysis noted, history says numbers below 40% are a warning sign for congressional members of the president’s party facing competitive races.
Legislative Leverage
A president’s approval rating also affects their ability to move legislation through Congress. Members of the president’s own party in competitive districts become more cautious about associating with an unpopular president. Opposition members feel less pressure to compromise. White House policy priorities face greater resistance in Congress when the president’s public standing is weak.
What Voters in the President’s Party Do
Approval ratings also reveal the stability of a president’s base. When overall approval falls primarily because independents and soft supporters are moving away while the base holds firm, the president retains more political leverage with his own party’s members. When the base itself shows signs of erosion, the political pressure on the president’s legislative agenda and on vulnerable members of his party intensifies significantly.
What the Numbers Tell Us Right Now
Putting the current data in historical context: Trump’s approval ratings in the high 30s in spring 2026 place him in the lower tier of second-term presidents at a comparable point in their administration. The UMass Lowell data shows that dissatisfaction is concentrated around economic policies, the Iran conflict, and immigration enforcement measures, with majorities expressing frustration across each of those issue areas.
The Roper Center’s presidential approval tracking tools allow readers to compare approval ratings across all presidents since Truman using consistent methodology. The American Presidency Project’s historical data provides the full record of where each president stood at the end of their term.
Together, those resources and the current polling from institutions like UMass Lowell provide the most complete and reliable picture available of where presidential approval ratings stand and what they have historically meant for the balance of power in Washington.
The Bottom Line
Presidential approval ratings are the product of a structured, methodologically defined process that has been refined over nearly 90 years of American polling. They are not infallible. Single polls carry margins of error. Methodological choices affect results. Partisan polarization creates structural challenges for modern pollsters. But when read carefully, tracked over time, and compared across multiple independent sources, approval ratings remain the most consistent and historically grounded measure available of how the public evaluates the president’s performance.
In 2026, as election updates in the US continue to track the political environment heading toward November, Trump’s approval ratings represent more than a news headline. They are a data point in a system built over decades, compared against a full historical record, and used by campaigns, legislators, and analysts to understand where American politics is heading and why.
References:
Roper Center for Public Opinion Research, Cornell University. Presidential Approval Highs and Lows
The American Presidency Project, University of California Santa Barbara. Final Presidential Job Approval Ratings
UMass Lowell Center for Public Opinion. National Poll March 2026
Roper Center for Public Opinion Research, Cornell University. Presidential Approval Ratings