
U.S. refugee admissions have fluctuated markedly between fiscal year 2020 and 2025. Policy decisions, global displacement patterns, processing capacity, and security requirements have shaped how many refugees are accepted in the U.S. each year. The United States sets an annual refugee admissions ceiling through presidential determination after consultation with Congress. Actual U.S. refugee resettlement numbers often fall below this ceiling due to operational limits and rigorous vetting. This article provides a detailed, data-driven examination of how many refugees has the U.S. accepted in the last 5 years, the reasons behind the trends, and the program’s connection to broader U.S. immigration policy and governance.
What Are U.S. Refugee Admissions
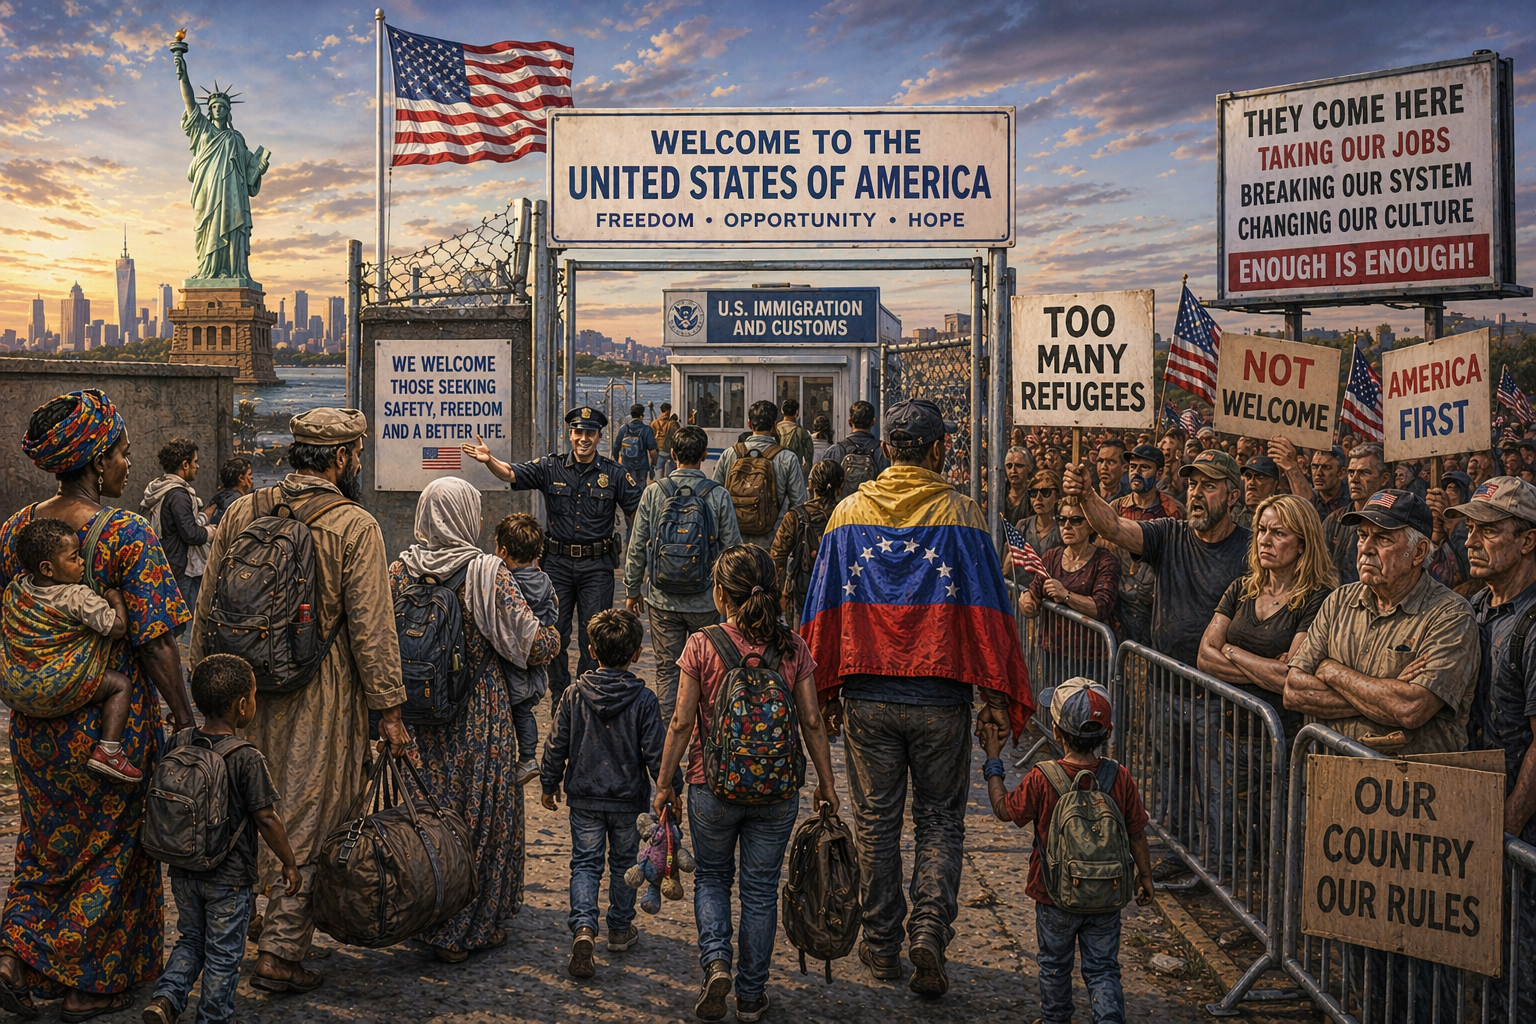
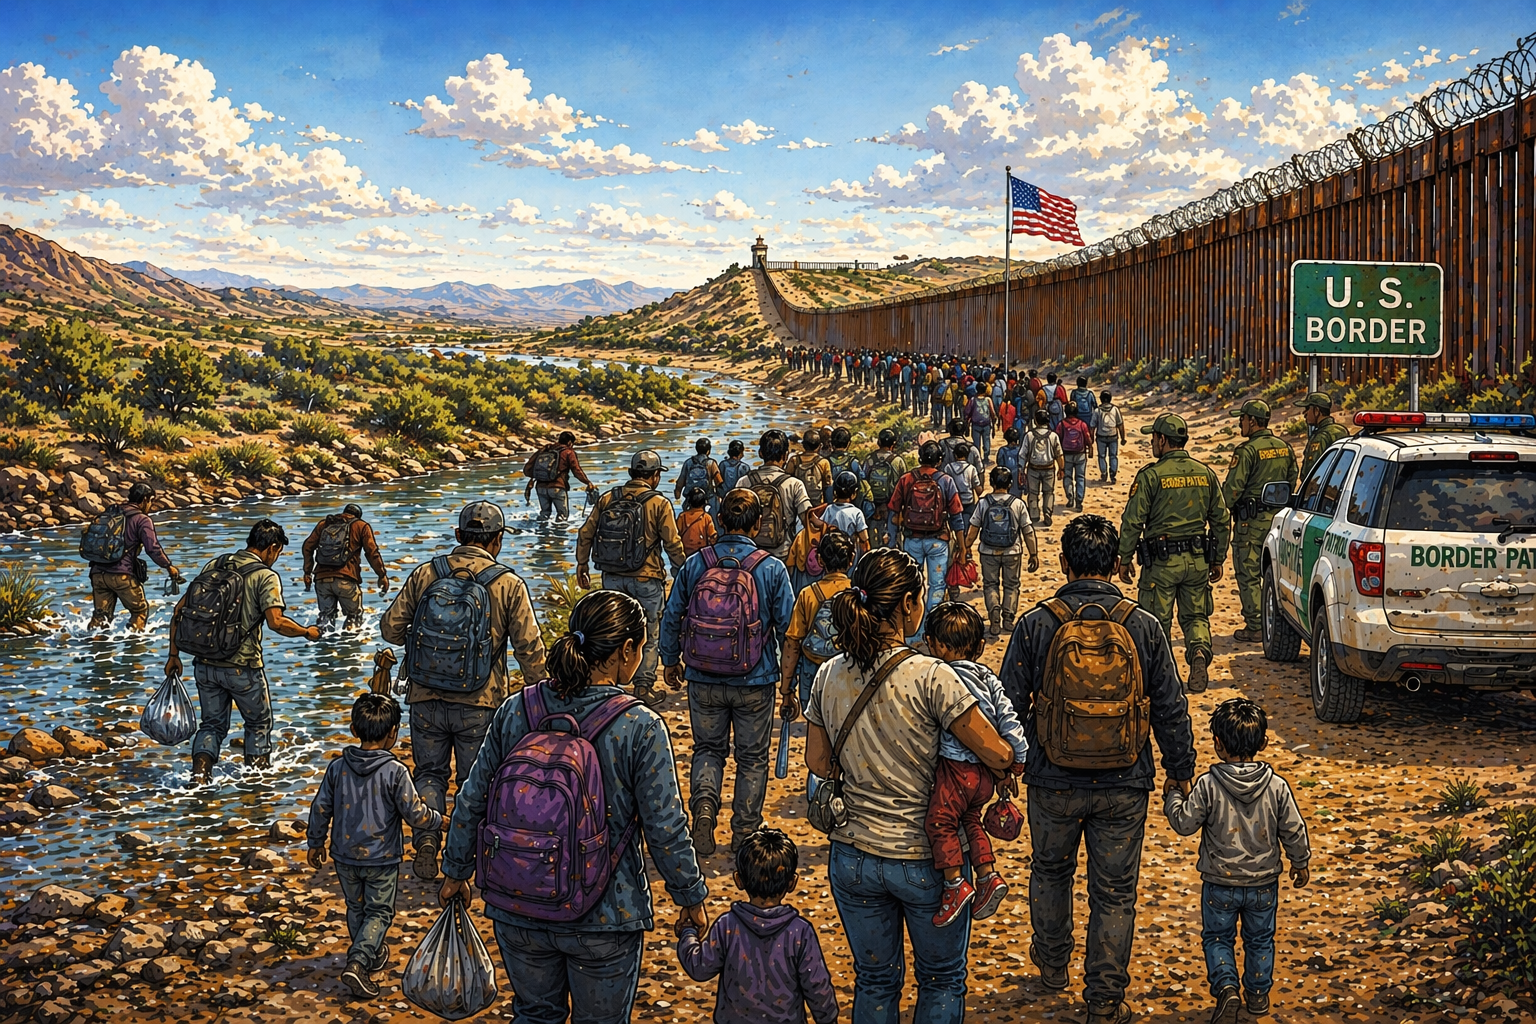
Refugees are individuals outside their home country who cannot or will not return due to persecution or a well-founded fear of persecution based on race, religion, nationality, membership in a particular social group, or political opinion. The U.S. Refugee Admissions Program (USRAP) processes and approves them overseas before entry. This process differs from asylum, which applies to people who apply after arriving in the United States or at the border. The U.S. refugee resettlement program emphasizes thorough security screening by multiple federal agencies and nonprofit partners. The distinction between asylum vs refugee U.S. remains important: refugees are vetted abroad, while asylum seekers request protection after reaching U.S. territory.
U.S. Refugee Admissions by Year: 2020–2025
U.S. refugee admissions statistics 2020–2025 reveal a clear pattern of decline followed by recovery and later reduction. Official data from the U.S. Department of State and the Refugee Processing Center show the following arrivals by fiscal year:
2020: 11,814 refugees admitted
2021: 11,450 refugees admitted
2022: 25,520 refugees admitted
2023: 60,050 refugees admitted
2024: 100,060 refugees admitted
2025: Approximately 38,102 refugees admitted (with program adjustments during the year)
Admissions remained near historic lows in 2020 and 2021, rose steadily through 2024, and decreased in 2025. These figures reflect shifts in the refugee admissions ceiling, processing capacity, and policy priorities across administrations.
Why Refugee Numbers Changed in the U.S. Recently
Several structural factors explain why refugee numbers changed in the U.S. recently. U.S. refugee policy changes under different administrations directly influenced annual ceilings and processing priorities. COVID-19 restrictions severely limited overseas operations in 2020 and 2021, creating large backlogs. After 2021, expanded staffing, streamlined procedures, and increased domestic resettlement infrastructure drove higher annual refugee admissions U.S. in 2023 and 2024. Global displacement patterns and security screening timelines also played significant roles. Actual admissions consistently remained below the set ceiling due to logistical challenges and rigorous vetting requirements.
Refugee Admissions Ceiling vs Actual Intake
Each year the president establishes a refugee cap United States after consulting Congress. This ceiling represents the maximum number allowed, often broken down by region. In recent years the ceiling reached 125,000, yet actual refugee intake United States statistics frequently fell short. The gap stems from processing delays, security checks, medical screenings, and operational limits. Congressional Research Service reports note that rebuilding program capacity after low years required significant time and resources. The difference between the ceiling and actual intake highlights the practical constraints of the U.S. immigration policy refugees framework.
Which Countries Send the Most Refugees to the U.S.
Refugees accepted in the U.S. each year come from regions experiencing conflict and persecution. Between 2020 and 2025, the largest shares originated from Africa, the Near East/South Asia, and Latin America/Caribbean. Top countries of origin have included the Democratic Republic of the Congo, Afghanistan, Syria, Myanmar, and Venezuela. These patterns reflect global humanitarian crises and shifting displacement flows. Regional allocations in the annual presidential determination guide processing priorities, though actual arrivals depend on referral volumes and successful vetting outcomes.
How the U.S. Refugee Resettlement System Works
The U.S. refugee resettlement program follows a structured, multi-step process designed to ensure both security and eligibility. Referrals typically come from the United Nations High Commissioner for Refugees or U.S. embassies. Applicants undergo extensive security screening by multiple agencies, including biometric and biographic checks. Interviews, background investigations, and medical examinations follow. Once approved, refugees receive travel assistance and initial resettlement support through nonprofit agencies. The entire process can take 18 to 36 months or longer. Nine national resettlement agencies and their local affiliates coordinate placement in communities across the United States.
What U.S. Refugee Admissions Mean for Policy and Elections
U.S. refugee admissions reflect federal policy decisions made through the annual presidential determination and congressional consultation. These choices balance humanitarian commitments with national security, processing capacity, and domestic resource allocation. Debates over refugee intake frequently appear in broader immigration discussions and form part of ongoing election updates in the US. Voters and candidates weigh humanitarian obligations against concerns about security, economic impact, and program sustainability. The scale of admissions often signals administration priorities on global leadership and domestic governance.
When government agencies face funding uncertainties or potential shutdowns, the effects ripple through multiple systems, including border security, screening operations, and emergency response capabilities that support the overall immigration framework. For a closer look at how such disruptions impact daily operations, see DHS Shutdown: How It Affects TSA, Border Patrol, and Emergency Response. These operational challenges often become central topics during election updates in the US, as voters weigh the balance between humanitarian commitments and the practical ability of federal agencies to manage immigration and security effectively.
Key Insights on U.S. Refugee Admissions 2020–2025
U.S. refugee admissions dropped to historic lows in 2020 and 2021 due to capacity limits and policy constraints.
Numbers rose steadily from 2022 through 2024 as the program rebuilt processing infrastructure.
Actual arrivals consistently remained below the refugee admissions ceiling because of security and logistical factors.
Top origin countries shifted with global displacement, with notable increases from Africa, the Middle East, and Latin America.
The system balances humanitarian goals with rigorous vetting, making U.S. refugee policy changes a recurring topic in election debates and governance discussions.
U.S. refugee admissions illustrate how federal decisions on ceilings, processing, and priorities shape humanitarian outcomes while influencing domestic policy debates. Tracking these trends provides important context for understanding the balance between security, capacity, and international responsibilities in American governance.
References:
U.S. Department of State. Refugee Admissions
Refugee Processing Center. Admissions & Arrivals
U.S. Department of Homeland Security. Refugees
Congressional Research Service. Refugee Admissions Overview